
How to read the dashboard
Overview
The dashboard of XB: Bundles Quantity Breaks opens when you open the app. It shows your setup progress, your top offers, your usage and the revenue the offers bring.
What the dashboard shows
- Setup guide and App Status: whether the app embed is on and your first offer is created. See Getting started with XB: Bundles Quantity Breaks.
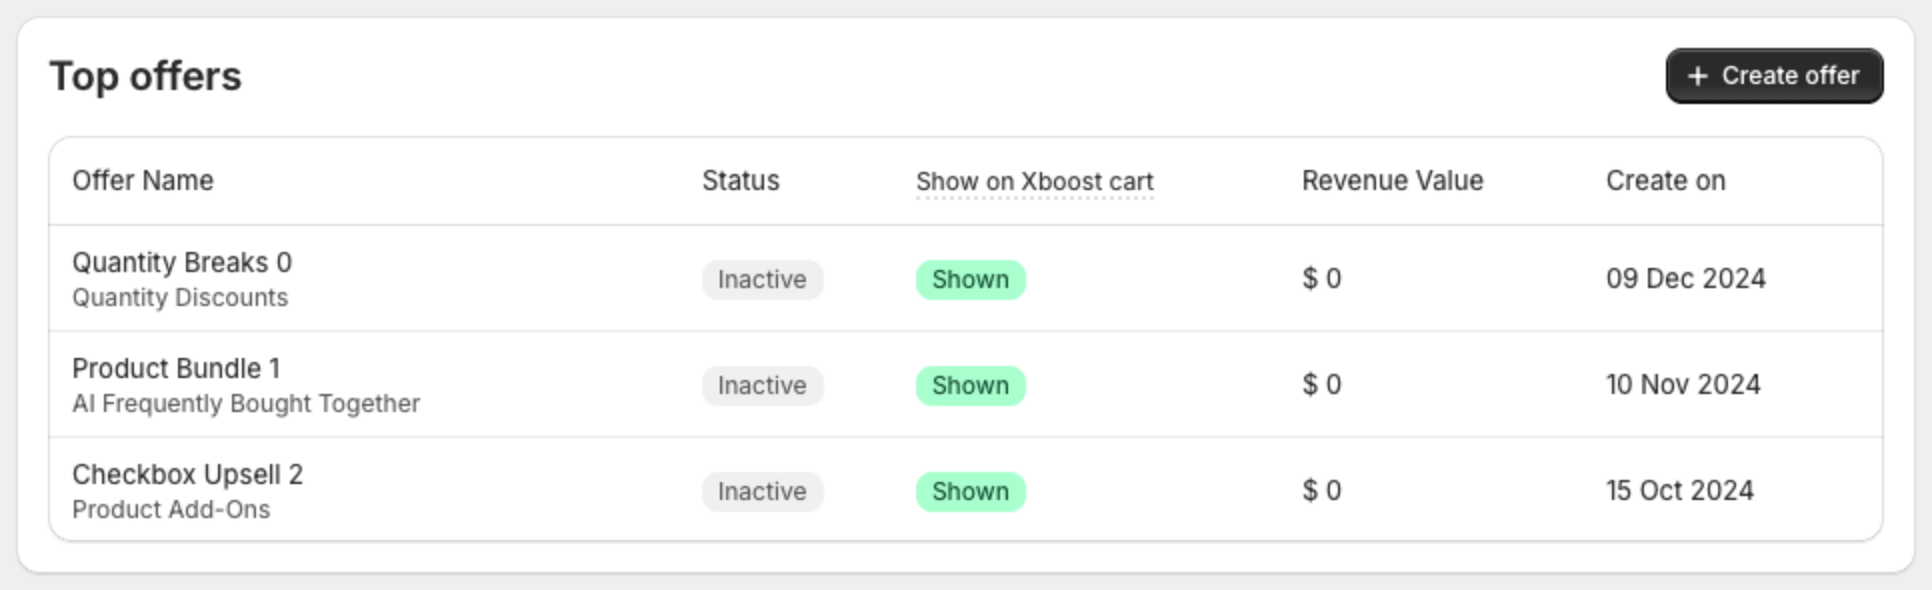
- Top offers: your offers with Status, Show on Xboost cart, Revenue Value and Create on. Click Create offer to add one.
- Usage overview: the revenue generated through the app this month, against your plan limit, and when it resets.

- Analytics: for a period you pick, for example Last 7 days: App-Generated Revenue, Total order with Xboost and Xboost AOV (average order value of orders with an offer), with the change against the previous period.
